Strength Influencing Factors of Cement Concrete
In this article we will consider the strength of concrete with Portland cement as the sole binder. The effect of additions will be discussed as well.
Transition/Interface Zone
Before looking at the relationships between the strength of concrete and the many factors that influence it, we need to introduce an extremely important aspect of concrete’s structure.
Concrete is, of course, a mixture of paste and aggregate, and it is the interface between these that is of great significance. The paste close to the aggregate surface is substantially different to that of the bulk paste, and crucially this transition or interface zone is significantly more porous and therefore weaker than the rest of the paste.
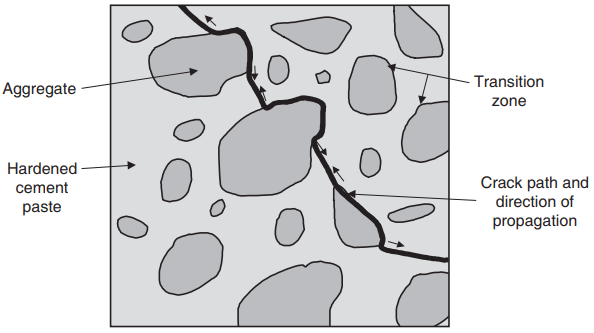
As the load on the concrete increases, cracking will start in this zone, and subsequently propagate into the HCP until crack paths are formed through the concrete, as shown in Fig. 1, which when sufficiently extensive and continuous will result in complete breakdown, i.e. failure.
The overall effect is that the strength of a sample of concrete is nearly always less than that of the bulk cement paste within it. The formation, structure and consequences of the transition zone have been the focus of much research since the mid-1980s.
Suggested mechanisms for its formation include an increased water:cement ratio at the paste aggregate/interface due to:
- the ‘wall effect’, whereby the cement grains cannot pack as efficiently next to the aggregate surface as they can in the bulk paste
- mix water separation at the interface due to the relative movement of the aggregate particles and cement paste during mixing, leading to a higher local water:cement ratio.
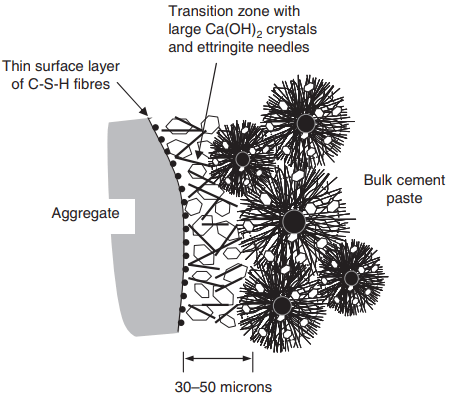
paste–aggregate interface.
Although there are some differences of opinion, there is a general consensus that the zone is between 30 and 50 microns wide and that its structure – in a much simplified form – is as shown in Fig. 2. This shows two main features:
- a very thin surface layer of calcium silicate hydrate fibres on the aggregate, also containing some small calcium hydroxide (portlandite) crystals
- a greater concentration of larger calcium hydroxide crystals and fine needles of calcium sulphoaluminate (ettringite) than in the bulk paste and hence a greater porosity.
Although the zone’s porosity will reduce with time with the continuing deposition of hydration products (chiefly C-S-H), we should think of concrete as a three-phase material – HCP, aggregate and the transition zone.
It will be useful to bear this model in mind during the discussion of the more important factors that affect concrete strength that now follows.
Water:Cement Ratio
The strength of cement paste is governed by its porosity, which in turn depends on the water:cement ratio and degree of hydration. The overall dependence of the strength of concrete on the amount of cement, water and air voids within it was recognised in 1896 by Feret, who suggested a rule of the form:
fc = K(c/{c + w + a})2
where fc = strength, c, w and a are the absolute volumetric proportions of cement, water and air, respectively, and K is a constant.
Working independently, Abrams, in 1918, demonstrated an inverse relationship with concrete strength of the form:
fc = k1/(k2 w/c)
This has become known as Abrams’ Law, although strictly, as it is based on empirical observations, it is a rule. The constants K, k1 and k2 are empirical and depend on age, curing regime, type of cement, amount of air entrainment, test method and, to a limited extent, aggregate type and size.
Feret’s rule and Abrams’ law both give an inverse relationship between strength and water:cement ratio for a fully compacted concrete of the form shown in Fig. 3. It is important to recognise the limitations of such a relationship.
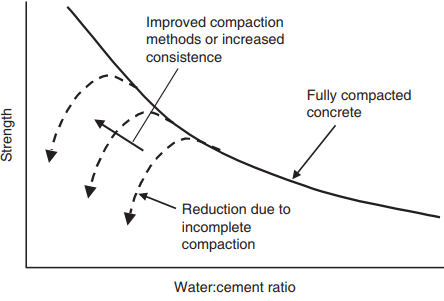
and water:cement ratio of concrete.
First, at low water:cement ratios, the concrete’s consistence decreases and it becomes increasingly more difficult to compact. Feret’s rule recognises that increasing air content will reduce the strength, and in general the strength will decrease by 6% for each 1% of included air by volume.
This leads to the steep reduction in strength shown by the dashed lines in Fig. 3. The point of divergence from the fully compacted line can be moved further up and to the left by the use of more efficient compaction and/or by improvements in consistence without increasing the water:cement ratio, for example by using plasticisers or superplasticisers.
Without such admixtures it is difficult to achieve adequate consistence for most normal compaction methods at water:cement ratios much below 0.4; with admixtures this limit can be reduced to 0.25 or even less. Abrams himself showed that, at the other end of the scale, his rule was valid for water:cement ratios of up to 2 or more.
However, at these high values the paste itself is extremely fluid, and it is very difficult to achieve a homogeneous, cohesive concrete without significant segregation.
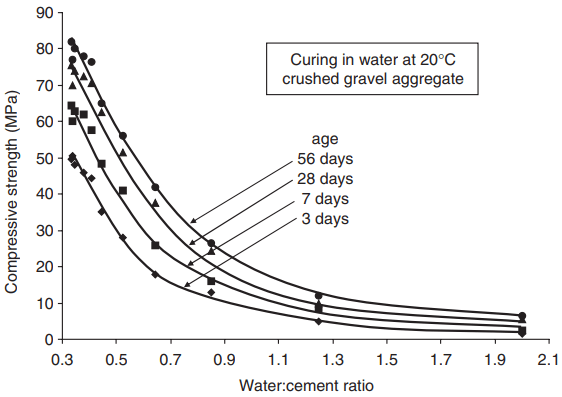
In practice water:cement ratios in excess of 1 are rarely used. Figure 4 shows a recent set of results obtained with CEM I 42.5N Portland cement, where good compaction was achieved in laboratory conditions at water:cement ratios down to 0.33.
This gives a good idea of typical concrete performance, but we must add our normal proviso that the use of other constituent materials (cement source, aggregate type etc.) will give different strength levels.
Age
The degree of hydration increases with age, leading to the effect of age on strength apparent from Fig. 4. The rate of hydration depends on the cement composition and fineness and so both of these will affect the rate of gain of strength.
The strength at 28 days is often used to characterise the concrete for design, specification and compliance purposes, probably because it was originally thought to be a reasonable indication of the longterm strength without having to wait too long for test results.
However strengths at other ages will often be important, for example during construction and when assessing long-term performance. Eurocode 2 (BS EN 1992) gives the following relationships for estimating the strength at any age from the 28-day strength for concrete kept at 20°C and high humidity:
fc(t) = b(t).fc(28)
where fc(t) is the strength at age t days, fc(28) is the 28-day strength and:
b(t) = exp{s[1 – (28/t) 0.5]}
where s is a coefficient depending on the cement strength class:
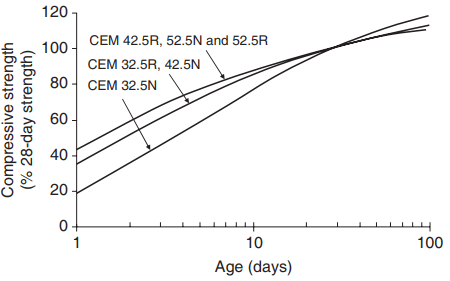
s = 0.2 for CEM 42.5R, 52.5N and 52.5R
s = 0.25 for CEM 32.5R and 42.5N
s = 0.38 for CEM 32.5N
strength of concrete
These equations have been used to produce the relationships shown in Fig. 5. Depending on the strength class the 3-day strength is between 40 and 65% of the 28-day strength and the 7-day strength between 60 and 80% of the 28-day strength. This figure also shows that:
- the strength gain continues well beyond 28 days. The hydration reactions are never complete and, in the presence of moisture, concrete will in fact continue to gain strength for many years, although, of course, the rate of increase after such times will be very small
- the long-term strength beyond 28 days is higher with cements that give lower short-term strength. This is because the microstructure is more efficiently formed at slower rates of hydration; in other words, if you can afford to wait long enough, then the final result will be better.
Temperature
A higher temperature maintained throughout the life of a concrete will result in higher short-term strengths but lower long-term strengths, a similar effect to that just described for cement class. Also, an early age heating–cooling cycle from heat of hydration effects can lead to lower long-term strength, but the effect can be reduced or even eliminated by the incorporation of fly ash or ground granulated blast furnace slag.
Humidity
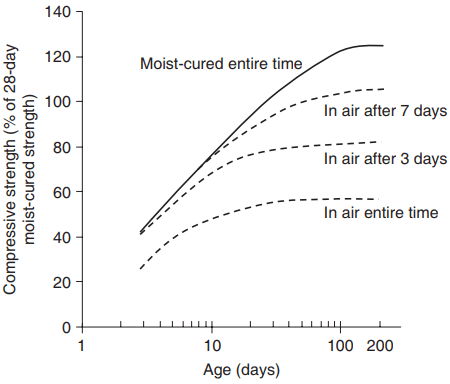
A humid environment for adequate curing is very necessary; for this reason concrete stored in water will achieve a higher strength than if cured in air for some or all of its life, as shown in Fig. 6. Also, specimens cured in water will show a significant increase in strength (5% or more) if allowed to dry out for a few hours before testing.
development of concrete strength.
Aggregate Properties, Size and Volume Concentration
As discussed above, for normal aggregate it is the strength of the paste–aggregate bond or transition zone that has a dominant effect on concrete strength; the aggregate strength itself is generally significant only in very-high-strength concrete or with the relatively weaker lightweight aggregates.
Tests have shown that with some carbonate and siliceous aggregates there is evidence that the structure and chemistry of the transition zone are influenced by the aggregate mineralogy and surface texture; for example limestone aggregates give excellent bond (Struble et al., 1980).
Crushed rocks tend to have rougher surfaces which, together with the increased mechanical interlocking of the angular aggregate particles, means that concretes made with crushed rocks are typically some 15 – 20% stronger than those made with uncrushed gravels, provided all other mix proportions are the same.
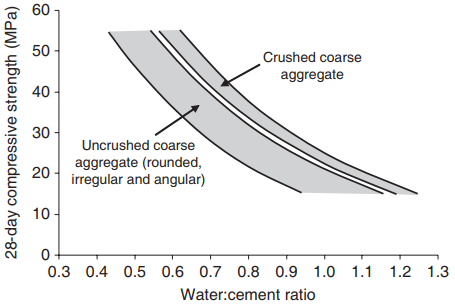
Figure 7 shows the range of strengths that are obtained from some cements and aggregates used in the UK, from which the effect of aggregate type is apparent. The use of a larger maximum aggregate size reduces the concrete’s strength, again provided all other mix proportions are the same.
The reduction is relatively small – about 5% – with an increase in aggregate size from 5 to 20 mm at normal concrete strengths, but greater reductions (up to 20%) are obtained at higher strength and with larger aggregate particle sizes.
Larger aggregates have a lower overall surface area with a weaker transition zone, and this has a more critical effect on the concrete’s strength at lower water:cement ratios.
In fresh concrete, the decreased surface area with increased aggregate size leads to increased consistence for the same mix proportions, and therefore for mix design at constant consistence the water content can be reduced and a compensating increase in strength obtained.
Increasing the volumetric proportion of aggregate in the mix will, at a constant water:cement ratio, produce a relatively small increase in concrete strength (typically a 50% increase in aggregate content may result in a 10% increase in strength).
This has been attributed, at least in part, to the increase in aggregate concentration producing a greater number of secondary cracks prior to failure, which require greater energy, i.e. higher stress, to reach fracture.
This effect is only valid if the paste content remains high enough to at least fill the voids in the coarse/fine aggregate system, thereby allowing complete consolidation of the concrete. This therefore imposes a maximum limit to the aggregate content for practical concretes.
Strength of Concrete Containing Additions
Type 2 additions – fly ash, ggbs, microsilica and metakaolin – that lead to the formation of further calcium silicate hydrates. When each addition is used within its overall dosage limitation, the general effect is an increase in long-term strength compared to the equivalent Portland cement mix (i.e. with the two mixes being compared differing only in the binder composition). This is owing to a combination of:
- better packing of the particles in the fresh state, leading to an overall reduced porosity of the hardened cement paste after hydration
- preferential enhancement of the transition zone which, as we have seen, is of higher porosity and is rich in portlandite and is therefore a prime target for the secondary reactions.
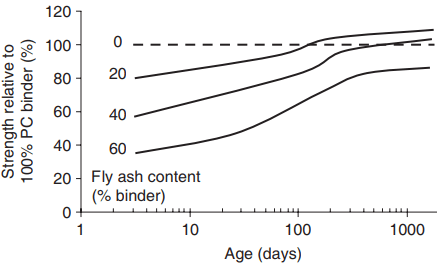
Not surprisingly, the strength of mixes containing additions does take some time to reach and overtake that of the equivalent Portland cement mix. As an example, Fig. 8 shows the strength gain of mixes with binders of up to 60% fly ash compared to that of a mix with 100% Portland cement. With 20% fly ash the strength exceeds that of the 100% PC mix after about 3 months; with 40% fly ash the ‘cross-over’ is some months later; and with 60% fly ash it appears never to reach the strength of the PC mix.
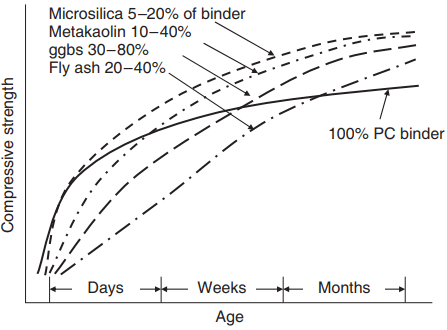
characteristics of concrete containing Type 2 additions.
In this last case there is insufficient calcium hydroxide produced by the cement, even after complete hydration, to react with all the silica in the fly ash. Figure 9 is a schematic that illustrates the general strength-gain behaviour of mixes with all the four Type 2 additions previously considered when each is used within its normal dosage limitation.
The ‘cross-over’ point for microsilica mixes is very early, sometimes within a day; metakaolin mixes take a few days, ggbs mixes days or weeks, and pfa mixes weeks or months. The reasons for the different rates of strength gain with the four different materials lie in their characteristics, which can be summarised as:
- the extremely fine particles, which act as nucleation sites for hydrate deposition, and very high active silica content of the microsilica result in the strength quickly overtaking that of the equivalent Portland cement mix
- metakaolin is somewhat coarser so it is a little slower to react, but it contains a high active silica content and is therefore not far behind the microsilica mixes
- ggbs and fly ash have similar particle sizes to Portland cement, but ggbs also contains its own calcium oxide, which contributes to the secondary reactions and so it is more than just a pozzolanic material.
If the slower rate of gain of strength is a problem during construction, mixes can of course be modified accordingly, e.g. by using plasticisers to maintain workability at a reduced water:cement ratio. It is however difficult to do more than generalise on the timescales and magnitude of the strength characteristics, for two reasons:
- The vast amount of published information on the properties of concrete containing additions shows that with each one there is a wide range of performance (not just of strength, but also of all other properties), owing mainly to the differences in physical and chemical composition of both the addition and the Portland cement in the various test programmes.
- Each set of tests will have been designed for a different purpose and therefore will have a different set of variables, such as changing the water content to obtain equal workability or equal 28-day strength, and therefore it is often difficult to compare like with like (indeed, this a problem facing students in nearly all areas of concrete technology).
The contribution of the addition to strength is often expressed in terms of an activity coefficient or cementing efficiency factor (k), which is a measure of the relative contribution of the addition to strength compared to an equivalent weight of Portland cement.
This means that if the amount of the addition is x kg/m3 , then this is equivalent to kx kg/m3 of cement, and the concrete strength is that which would be achieved with a cement content of c + kx, where c is the amount of cement.
If k is greater than 1, then the addition is more active than the cement, and if less than 1, it is less active. Its value will clearly increase with the age of the concrete, and will also vary with the amount of addition and other mix proportions. For 28-day-old concrete and proportions of the addition within the overall limits of Fig. 9, values of 3 for microsilica, 1 for ggbs and 0.4 for fly ash have been proposed (Sedran et al., 1996), although again, a considerable range of values has been suggested by different authors. The cementing efficiency factor approach is useful in mix design.