Some materials have dramatically different behavior in compression than in tension, and in some cases these materials are used primarily to resist compressive stresses. Examples include concrete and building stone.
Data from compression tests are therefore often needed for engineering applications. Compression tests have many similarities to tension tests in the manner of conducting the test and in the analysis and interpretation of the results. Since tension tests have already been considered in detail in previous articles, the discussion here will focus on areas where these two types of tests differ.
Test Methods for Compression
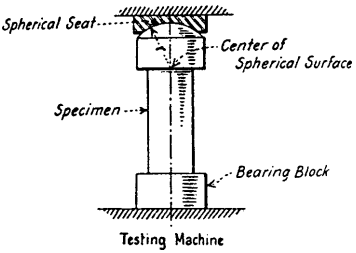
A typical arrangement for a compression test is shown in Fig. 1. Uniform displacement rates in compression are applied in a manner similar to a tension test, except, of course, for the direction of loading. The specimen is most commonly a simple cylinder having a ratio of length to diameter, L/d, in the range 1 to 3.
However, values of L/d up to 10 are sometimes used where the primary objective is to accurately determine the elastic modulus in compression. Specimens with square or rectangular cross sections may also be tested.
Conversely, if L/d is small, the test result is affected by the details of the conditions at the end. In particular, as the specimen is compressed, the diameter increases due to the Poisson effect, but friction retards this motion at the ends, resulting in deformation into a barrel shape.
This effect can be minimized by proper lubrication of the ends. In materials that are capable of large amounts of deformation in compression, the choice of too small of an L/d ratio may result in a situation where the behavior of the specimen is dominated by the end effects, so that the test does not measure the fundamental compressive behavior of the material.
Considering both the desirability of small L/d to avoid buckling and large L/d to avoid end effects, a reasonable compromise is L/d = 3 for ductile materials. Values of L/d = 1.5 or 2 are suitable for brittle materials, where end effects are small.
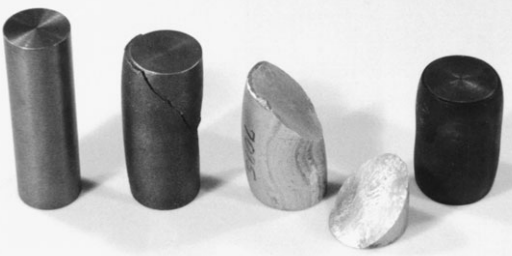
Diameters before testing were approximately 25mm, and lengths were 76mm.
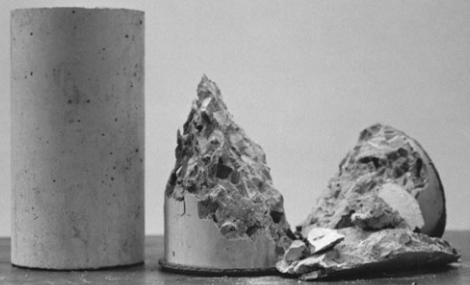
Some examples of compression specimens of various materials both before and after testing are shown in Figs. 2 and 3. Mild steel shows typical ductile behavior, specifically large deformation without fracture ever occurring. The gray cast iron and concrete behaved in a brittle manner, and the aluminum alloy deformed considerably, but then also fractured. Fracture in compression usually occurs on an inclined plane or on a conical surface.
Materials Properties in Compression
The initial portions of compressive stress–strain curves have the same general nature as those in tension. Thus, various materials properties may be defined from the initial portion in the same manner as for tension, such as the elastic modulus E, the proportional limit σp, and the yield strength σo.
The ultimate strength behavior in compression differs in a qualitative way from that in tension. Note that the decrease in force prior to final fracture in tension is associated with the phenomenon of necking. This, of course, does not occur in compression.
In fact, an opposite effect occurs, in that the increasing cross-sectional area causes the stress–strain curve to rise rapidly rather than showing a maximum. As a result, there is no force maximum in compression prior to fracture, and the engineering ultimate strength is the same as the engineering fracture strength. Brittle and moderately ductile materials will fracture in compression. But many ductile metals and polymers simply never fracture. Instead, the specimen deforms into an increasingly larger and thinner pancake shape until the force required for further deformation becomes so large that the test must be suspended.
Ductility measurements for compression are analogous to those for tension. Such measures include percentage changes in length and area, as well as engineering and true fracture strain. The same measures of energy capacity may also be employed, as can constants for true stress–strain curves.
Trends in Compressive Behavior
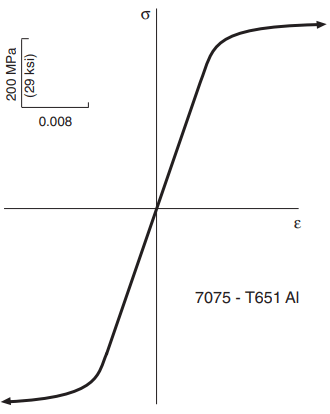
Ductile engineering metals often have nearly identical initial portions of stress–strain curves in tension and compression; an example of this is shown in Fig. 4. After large amounts of deformation, the curves may still agree if true stresses and strains are plotted.
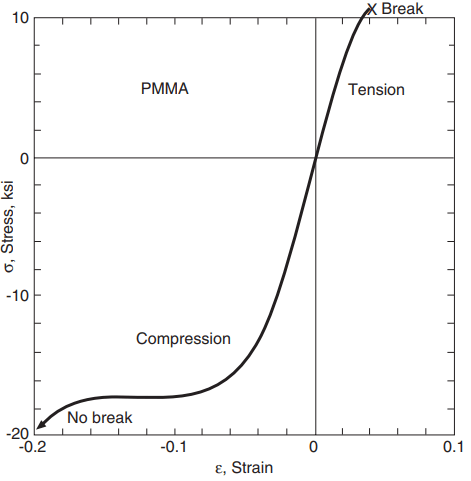
Many materials that are brittle in tension have this behavior because they contain cracks or pores that grow and combine to cause failures along planes of maximum tension—that is, perpendicular to the specimen axis. Examples are the graphite flakes in gray cast iron, cracks at the aggregate boundaries in concrete, and porosity in sintered ceramics. Such flaws have much less effect in compression, so materials that behave in a brittle manner in tension usually have considerably higher compressive strengths. Quite ductile behavior can occur even for materials that are brittle in tension, as for the polymer in Fig. 5.
Where compressive failure does occur, it is generally associated with a shear stress, so the fracture is inclined relative to the specimen axis. This type of fracture is evident for gray cast iron, an aluminum alloy, and concrete in Figs. 2 and 3.
Compare the cast iron fracture plane with that for tension. The tension fracture plane is oriented normal to the applied tension stress, which is typical of brittle behavior in all materials.
For brittle materials such as concrete and stone, some engineering applications involve multiaxial compressive stresses, as in foundations for buildings, bridges, and dams. A testing arrangement that simulates such conditions by employing hydraulic pressure for multiaxial testing is shown in Fig. 6.
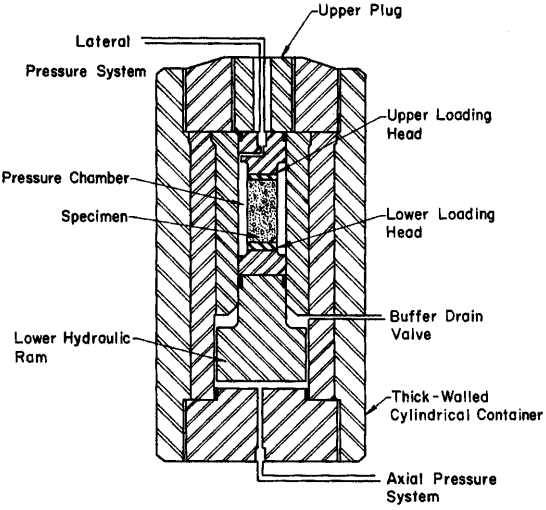
The axial pressure system provides a compressive force in the vertical direction, as for a simple compression test. And the lateral pressure system compresses the specimen laterally on all sides. The compressive strength of concrete or stone in the axial direction is affected by such lateral pressure; and for large values of lateral pressure, the compressive strength is substantially higher than in an ordinary compression test.