Strength and Failure of Bituminous Materials
The Road Structure
A flexible road structure consists of a number of layers of different materials. In structural terms, the purpose of the road is to distribute the applied load from the traffic to a level that the underlying subgrade can bear. The stresses induced by the loads are high at the surface but reduce with depth. Thus, the surfacing material must be of high quality, but at greater depths below the surface, economies can be achieved by using materials of lower strength.
Modes of Failure in Bituminous Structure
Roads deteriorate in a number of ways, but broadly there are two forms of failure – functional and structural. Functional failure (distress) is usually associated with the road surface through deterioration with time. This may be through breakdown of the surface material, for example through fretting or stone loss (ravelling), or alternatively, the surface texture of the surface course may be reduced, through polishing or abrasion, so that the skidding resistance drops below an acceptable level.
Structural deterioration (failure) develops gradually with the continued application of wheel loads. In the early stages, the rate of deterioration is very small and the structural changes are not perceptible and are difficult to measure. But with continued service, signs of structural change become clearer and the rate of deterioration accelerates. There are two modes of breakdown, which are illustrated in Fig. 1.
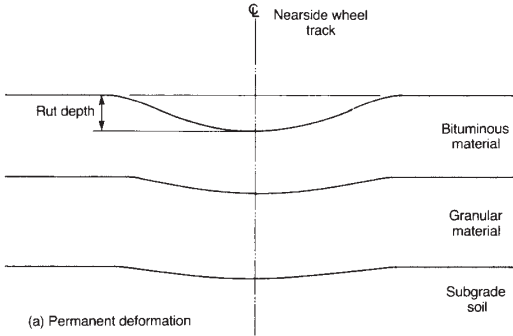
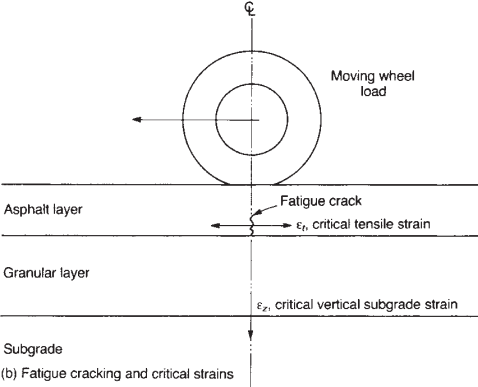
a flexible pavement (after Brown, 1980).
Firstly, permanent deformation occurs in the wheel tracks. This ‘rutting’ is associated with deformation of all the pavement layers and is linked to a loss of support from the structural layers of the road and the underlying subgrade. This structural rutting differs from the ‘non-structural’ permanent deformation found within the bituminous layers, which is an accumulation of the small irrecoverable part of the deformation caused by each wheel load due to the viscoelastic nature of the bitumen together with the mechanical support offered by the grading of the aggregate.
The second mode of failure is cracking, which appears along the wheel tracks. Cracking is caused by the tensile strain developed in the bound layers as each wheel load passes. It is therefore a function of both the size of tensile strain, and the repetitive nature of the loading; that is a fatigue failure. It is important to note, as Fig. 1 shows, that the cracking initiates at the base of the bound layer.
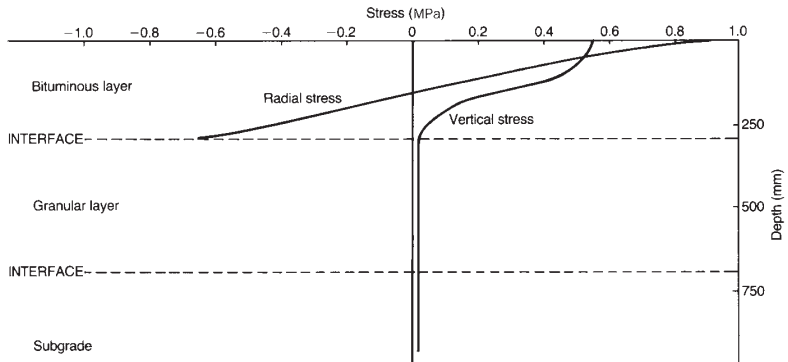
(after Peattie, 1978).
This is where the tensile stresses are highest, as shown in Fig. 2. It follows that, by the time the cracking is visible at the surface, the damage has been present for some time. In both modes of failure, the breakdown is caused by (a) the repetitive nature of the loading, and (b) the development of excessive strains in the structure.
This leads to the notion that, if failure can be defined, the life of a road can be determined provided that the loading can be assessed and the performance of the materials evaluated. Alternatively, the structural design of the road together with the make-up of the materials necessary to give the required properties may be determined, in order to provide a given life. In either case, it is necessary to define failure. In most civil engineering structures, structural failure renders the structure unusable and is often associated with collapse.
However, while roads may become less comfortable to drive on and less safe, they do not, except in very extreme cases, become unusable. Therefore failure for roads must be identified in terms of serviceability and/or repairability; that is, the extent of cracking and deformation which is just acceptable to drivers and/or which represents a condition that may be economically restored by repair, must be defined. A definition is provided, in terms of both modes of failure, which identifies three conditions: sound, critical, and failed.

Table 1 shows that if any cracking is visible at the surface, then the road is regarded as being at a critical condition or as having failed. Here the term ‘critical’ means that failure is imminent but the road still has sufficient structural capability to support strengthening and to provide an extended life from the strengthened road. If there are no signs of cracking, then the condition is defined in terms of the extent of permanent deformation. Thus, if the rut depth reaches 20 mm, the road is regarded as having failed.
Fatigue Characteristics
Fatigue cracking arises from the fact that under repeated applications of tensile stress/strain, a bituminous material will eventually fracture. The higher the level of stress and strain applied, the smaller the number of load applications before cracking occurs. For a particular level of stress and strain, the mixture proportions and nature of the bitumen dictate the number of cycles before cracking occurs.
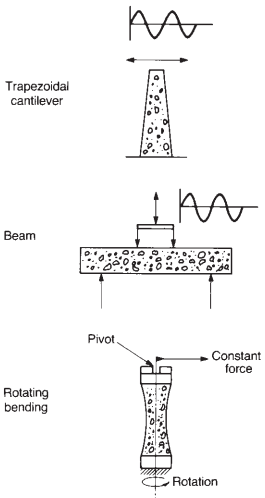
A number of laboratory tests have been developed to assess the fatigue characteristics of bituminous materials. The tests, illustrated in Fig. 3, are flexure tests and simulate the repeated bending action in the stiff bound layer of a pavement caused by the passage of each wheel load. The number of load cycles that a particular specimen can endure before failure depends on a number of factors, discussed below.
Stress and Strain Conditions
Fatigue tests may be conducted in two ways. They may be constant-stress tests, where each load application is to the same stress level regardless of the amount of strain developed, or they may be constant-strain tests, where each load application is to the same strain level regardless of the amount of stress required. These two alternatives produce quite different results.
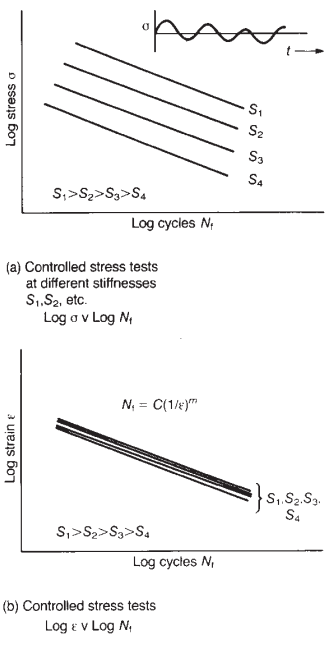
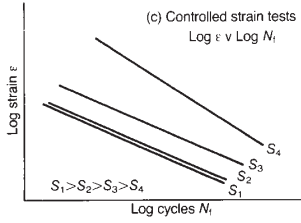
Figure 4a shows the general pattern of results from constant-stress tests. Each line represents a different test temperature, i.e. a different stiffness, and it can be seen that mixtures with higher stiffness have longer lives. Figure 4c shows the general pattern of results from constant-strain tests. Again each line represents a different temperature or stiffness and it can be seen that the outcome is reversed, with the mixtures of higher stiffness having the shortest lives.
This contrast may be explained in terms of the failure mechanism. Cracks initiate at points of stress concentration and propagate through the material until fracture occurs. If the stress level is kept constant, the stress level at the tip of the crack continues to be high so that propagation is rapid.
However, in a constant-strain test, the development of a crack causes a steady reduction in the applied stress level because the cracks contribute more and more to the strain as they propagate. Thus the stress at the crack tips reduces and the rate of propagation is slow. Thus it is important to establish which test condition is most relevant to actual pavement behaviour. It has been shown (Monismith and Deacon, 1969) that strain control is appropriate to thin layers (for example surfacing layers), whereas stress control is appropriate to thicker structural layers. This is because pavements are subject to a stress-controlled loading system, so that the main (and normally thick) structural layers are stress controlled.
However, the thin surface layer must move with the lower structural layers and so is effectively subject to strain control. Nevertheless, under lowtemperature conditions giving high stiffness, crack propagation is relatively quick even under straincontrolled loading, so the difference between the two loading conditions is small.
The Strain Criteria
If the results of a controlled-stress test are expressed in terms of an equivalent strain then the log–log plot of strain against number of load cycles produces a single linear relationship for all test conditions for a particular mixture, as shown in Fig. 4b.
In other words the relationship is independent of mixture stiffness. This suggests that strain is the principal criterion governing fatigue failure, and it has been demonstrated (Cooper and Pell, 1974) that flexure tests on a wide range of mixtures produce unique fatigue lines for each mixture. The general relationship defining the fatigue line is:
Nf = C(1/ε)m
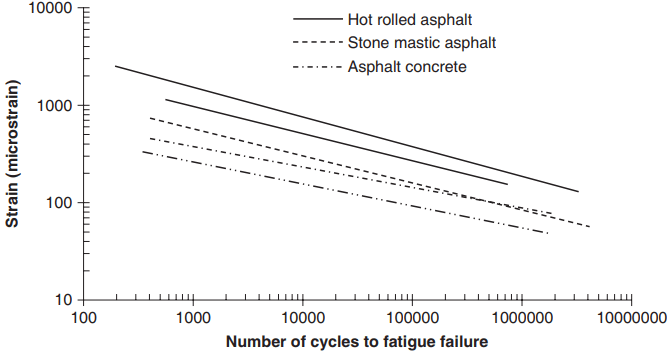
where Nf is the number of load cycles to initiate a fatigue crack, ε is the maximum applied tensile strain, and C and m are constants depending on the composition and properties of the asphalt mixture. The fatigue lines for a range of asphalt mixtures are shown in Fig. 5.
Effect of Mixture Variables
A large number of variables associated with the asphalt mixture affect the fatigue line. However, it has been shown (Cooper and Pell, 1974) that two variables are of prime importance. These are:
- The volume of bitumen in the mixture.
- The viscosity of the bitumen as measured by the softening point.
As the volume of bitumen increases up to 15%, the fatigue life increases, and as the bitumen becomes more viscous, with softening point increasing up to 60°C, the fatigue life also increases. Other factors are important insofar as they affect the two main variables. The void content of the mixture has an effect on the volume of bitumen.
The total void content is in turn affected by the particle shape and grading of the aggregate, the compactive effort, and the temperature. In other words there is a link between workability, compactive effort and void content, which is controlled by the bitumen content.
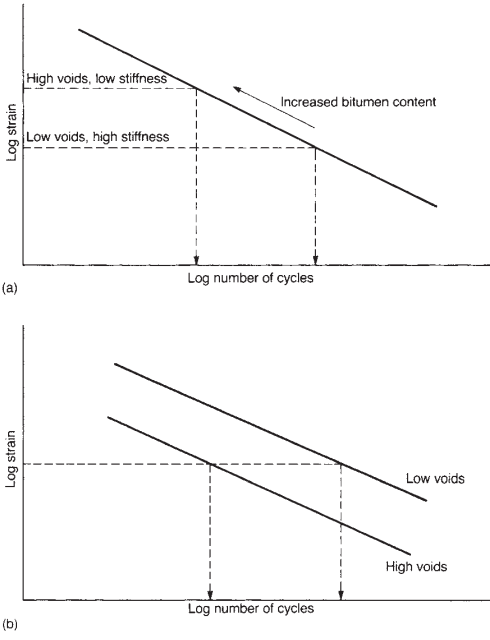
However, while higher bitumen content improves fatigue life, it also reduces stiffness, which leads to increased strain. Figure 6 illustrates the double influence of void content. Figure 6a shows the effect that increased bitumen content has on stiffness. The stiffness is reduced, which increases the strain under constant-stress conditions, causing a shift to the left along the fatigue line. Thus the fatigue life is reduced.
Figure 6b shows the influence that void content has on the fatigue line, so that for the same strain the fatigue life is reduced as void content increases. The change in position of the fatigue line corresponds to a change in material type, as was seen in Fig. 5, whereas the shift along a fatigue line due to a stiffness change corresponds to a change in degree of compaction.
However, in practice, both effects occur if the change in void content is associated with a change in bitumen content.