Bending and Torsion Tests
Various bending and torsion tests are widely used for evaluating the elastic modulus, strength, shear modulus, shear strength, and other properties of materials. These tests differ in a critical way from tension and compression tests, in that the stresses and strains are not uniform over the cross section of the test specimen.
The only useful exception is the case of torsion of thin-walled circular tubes, where the shear stress and strain are approximately uniform if the wall is sufficiently thin. In other cases of bending and torsion, the non-uniform stresses and strains create a situation where a stress–strain curve cannot be determined directly from the test data.
A procedure does exist for obtaining a stress–strain curve by numerically analyzing slopes on a moment versus curvature plot for rectangular cross sections in bending. And there is a similar procedure for analyzing torque versus twist angle data for solid round shafts in torsion.
These procedures are not covered here, but for torsion can be found in the books by Dieter (1986) and Hill (1998), and for both bending and torsion in the book by Nadai (1950).
Note that the simple equations commonly employed to calculate stresses for bending and torsion, and are based on linear-elastic behavior and so do not apply if the stress–strain behavior is nonlinear due to yielding.
Bending Tests
Bending tests on smooth (unnotched) bars of material are commonly used, as in various ASTM standard test methods for flat metal spring material, and for concrete, natural stone, wood, plastics, glass, and ceramics. Bending tests, also called flexure tests, are especially needed to evaluate tensile strengths of brittle materials, as such materials are difficult to test in simple uniaxial tension due to cracking in the grips. (Think of trying to grab a piece of glass in the jaw-like grips often used for testing flat pieces of metal.) The specimens often have rectangular cross sections and may be loaded in either three-point bending or four-point bending, as illustrated in Fig. 1.
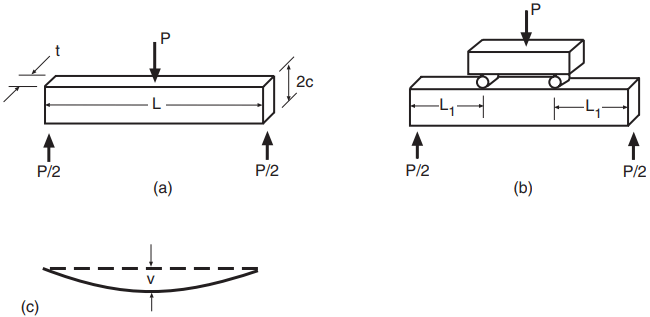
In bending, note that the stress varies through the depth of the beam in such a way that yielding first occurs in a thin surface layer. This results in the load versus deflection curve not being sensitive to the very beginning of yielding.
Also, if the stress–strain curve is not linear, as after yielding, the simple elastic bending analysis is not valid. Hence, bending tests are most meaningful for brittle materials that have approximately linear stress–strain behavior up to the point of fracture.
For materials that do have approximately linear behavior, the fracture stress may be estimated from the failure load in the bending test by simple linear elastic beam analysis:
σ = Mc/I …..(1)
Here, M is the bending moment. For a rectangular cross section of depth 2c and width t, as in Fig. 1, the area moment of inertia about the neutral axis is I = 2tc3/3.
Consider three-point bending of a beam of length L due to a force P at midspan, as in Fig. 1(a). In this case, the highest bending moment occurs at midspan and is M = P L/4. Equation 1 then gives

where Pf is the fracture force in the bending test and σfb is the calculated fracture stress. This is usually identified as the bend strength or the flexural strength, with the quaint term modulus of rupture in bending also being used.
Such values of σfb should always be identified as being from a bending test. This is because they may not agree precisely with values from tension tests, primarily due to departure of the stress–strain curve from linearity. Note that brittle materials are usually stronger in compression than in tension, so the maximum tension stress is the cause of failure in the beam. Corrections for nonlinearity in the stress–strain curve could be made on the basis of some other methods but this is virtually never done.
Yield strengths in bending are also sometimes evaluated. Equation 2 is used, but with Pf replaced by a load Pi , corresponding to a strain offset or other means of identifying the beginning of yielding. Such σo values are less likely than σfb to be affected by nonlinear stress–strain behavior, but agreement with values from tension tests is affected by the previously noted insensitivity of the test to the beginning of yielding.
The elastic modulus may also be obtained from a bending test. For example, for three-point bending, as in Fig. 1(a), linear-elastic analysis gives the maximum deflection at midspan. This is

The value of E may then be calculated from the slope dP/dv of the initial linear portion of the load versus deflection curve:

Elastic moduli derived from bending are generally reasonably close to those from tension or compression tests of the same material, but several possible causes of discrepancy exist:
- Local elastic or plastic deformations at the supports and/or points of load application may not be small compared with the beam deflection.
- In relatively short beams, significant deformations due to shear stress may occur that are not considered by the ideal beam theory used.
- The material may have differing elastic moduli in tension and compression, so that an intermediate value is obtained from the bending test. Hence, values of E from bending need to be identified as such.
For four-point bending, or for other modes of loading or shapes of cross section, Eqs. 2 to 4 need to be replaced by the analogous relationships from Appendix A that apply.
Heat-Deflection Test
In this test used for polymers, small beams having rectangular cross sections are loaded in three point bending with the use of a special apparatus described in ASTM Standard No. D648. Beams 2c = 13 mm deep, and t = 3 to 13 mm thick, are loaded over a span of L = 100 mm.
A force is applied such that the maximum bending stress, calculated by assuming elastic behavior, is either 0.455 MPa or 1.82 MPa. The temperature is then increased at a rate of 2◦C per minute until the deflection of the beam exceeds 0.25 mm, at which point the temperature is noted.
This heat-deflection temperature is used as an index to compare the resistance of polymers to excessive softening and deformation as a result of heat. It also gives an indication of the temperature range where the material loses its usefulness.
Torsion Test
Tests of round bars loaded in simple torsion are relatively easy to conduct, and unlike tension tests, they are not complicated by the necking phenomenon. The state of stress and strain in a torsion test on a round bar corresponds to pure shear, as illustrated in Fig. 2, where T is torque, τ is shear stress, and γ is shear strain. The same state of stress and strain also applies if the bar is hollow, such as a thin-walled circular tube.
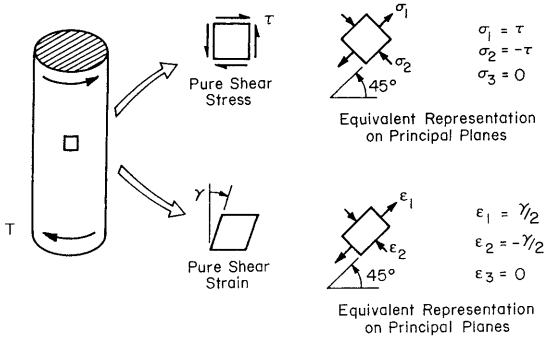
Note that with a 45◦ rotation of the coordinate axes, the pure shear stress and strain are equivalent to normal stresses and strains, as shown.
Fractures from torsion tests are shown in Fig. 3. The gray cast iron (top) behaves in a brittle manner, with fracture on planes of maximum tension stress, 45◦ to the specimen axis, consistent with Fig. 2.
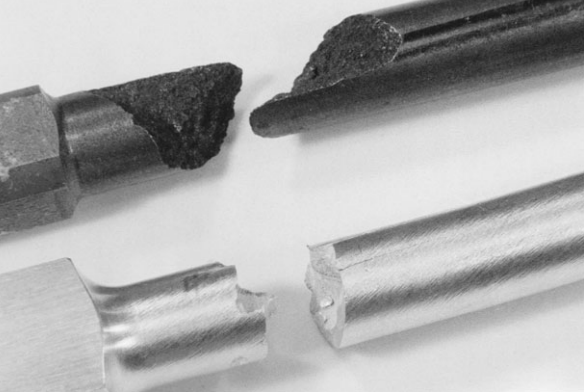
As the fracture wraps around the circumference, maintaining 45◦ to the specimen axis causes the helical fracture pattern shown. In contrast, ductile behavior occurs for the aluminum alloy (bottom), where fracture occurs on a plane of maximum shear stress transverse to the bar axis. For linear-elastic behavior, the shear stress τf at fracture can be related to the torque Tf . We obtain

where J is the polar moment of inertia of the cross-sectional area and r2 is the outer radius. Form (b) is obtained from (a) by evaluating J for a hollow bar or tube with inner radius r1.
A solid bar is included by letting r1 = 0. However, as a result of Eq. 5 being derived from linear-elastic behavior, τf values so calculated are inaccurate if there is nonlinear deformation (yielding), a situation similar to that for bending tests. However, this limitation can be largely overcome by testing thin-walled tubes, as discussed in the next section.
In a torsion test, the torque T is usually plotted versus the angle of twist θ. The shear modulus G can be evaluated from the slope dT/dθ of the initial linear portion of such a plot. Noting that the desired G is given by

where L is the bar length and J , r2, and r1 are the same as before, with r1 = 0 for a solid bar.
Torsion tests on solid bars are often conducted as a means of comparing the strength and ductility of different materials or variations of a given material. This is valid, as long as it is noted that stresses from Eq. 5 may be fictitious values, as they do not include the effects of yielding.
Testing of Thin-Walled Tubes in Torsion
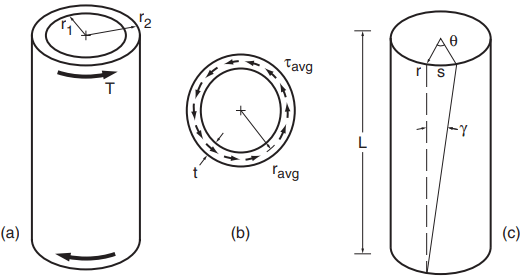
If it is desired to investigate significant nonlinear deformation in torsion, the most straightforward approach is to test thin-walled tubes, as illustrated in Fig. 4. The approximately uniform shear stress and strain through the wall thickness can be obtained from
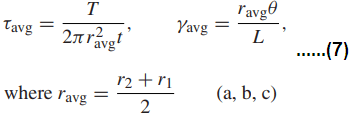
The wall thickness is t = r2 − r1, and ravg is the radius to the middle of the wall thickness. The subscripts avg for shear stress and strain indicate averages for these quantities that vary somewhat through the wall thickness.
By the use of Eq. 7, the shear stress–strain curve, τ versus γ , can be obtained directly and simply from T versus θ data.
The choice of a wall thickness for test specimens involves a compromise, with ratios in the range t/r1 = 0.10 to 0.25 being reasonable. The former gives only a 10% variation in strain through the wall, but is thin enough that buckling could be a problem. The latter value gives more resistance to buckling, but with a 25% variation in strain. Equation 7 can be derived with the aid of Fig. 4(b).
The shear stress τavg is treated as constant through the wall thickness. Multiplying this by the cross-sectional area gives the total annular force, which has a torque arm ravg, and which must equilibrate the torque T :

Solving for τavg then gives Eq. 7(a). Now consider a cylinder of any radius r that is twisted by an angle θ, as shown in Fig. 4(c). Noting that the shear strain is the distortion angle γ , which is assumed to be small compared with unity, the arc length s = rθ = Lγ , so that γ = rθ/L. Applying this for ravg gives Eq. 7(b). Also, applying the same relationship to compare γ for the inner and outer walls gives

Hence, for t/r1 = 0.1, we have γ2/γ1 = 1.10, or a 10% variation, as stated earlier, and similarly a 25% variation for t/r1 = 0.25.
The testing of thin-walled tubes in torsion is not nearly as prevalent as tension testing. But it nevertheless provides a viable alternative for characterizing the fundamental stress–strain behavior of materials.