Phase Diagrams of Alloys
To produce alloy metals, the components are heated to a molten state, mixed, and then cooled. The temperature at which the material transitions between a liquid and a solid is a function of the percentages of the components.
The liquid and solid states of a material are called phases, and a phase diagram displays the relationship between the percentages of the elements and the transition temperatures.
Phase Diagrams of Soluble Materials
The simplest type of phase diagram is for two elements that are completely soluble in both the liquid and solid phases. Solid solutions occur when the elements in the alloys remain dispersed throughout the matrix of the material in the solid state. A two-element or binary phase diagram is shown in Figure 1(a) for two completely soluble elements.

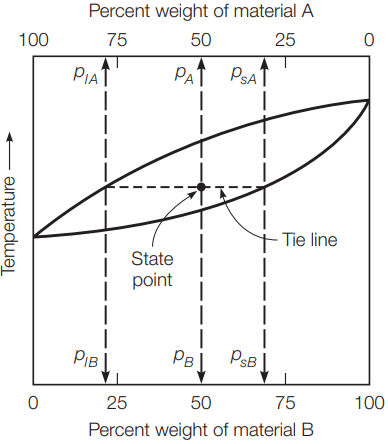
In this diagram, temperature is plotted on the vertical axis and the percent weight of each element is plotted on the horizontal axis. In this case, the top axis is used for element A and the bottom axis is used for element B. The percentage of element B increases linearly across the axis, while the percentage of element A starts at 100% on the left and decreases to 0% on the right. Since this is a binary phase diagram, the sum of the percentage of elements A and B must equal 100%.
In Figure 1(a), there are three areas. The areas at the top and bottom of the diagram have a single phase of liquid and solid material, respectively. Between the two single-phase areas, there is a two-phase area where the material is both liquid and solid. The line between the liquid and two-phase areas is the liquidus, and the line between the two-phase area and the solid area is the solidus.
For a given composition of elements A and B, the liquidus defines the temperature at which, upon cooling, the first solid crystals form. The solidus defines the temperature at which all material has crystallized. It should be noted that, for a pure element, the transition between liquid and solid occurs at a single temperature.
This is indicated on the phase diagram by the convergence of the liquidus and solidus on the left and right sides of Figure 1(a), where there are pure elements A and B, respectively. A specific composition of elements at a specific temperature is defined as the state point, as shown in Figure 1(b).
If the state point is above the liquidus, all the material is liquid and the composition of the liquid is the same as the total composition of the material. Similarly, if the state point is below the solidus, all the material is solid and the composition of the solid is the same as for the material.
In the two-phase region between the liquidus and the solidus, the percent of material that is in either the liquid or solid phase varies with the temperature. In addition, the composition of the liquid and solid phases in this region changes with temperature. The compositions of the liquid and solid can be determined directly from the phase diagram by using the lever rule.
First a tie line is established by connecting the liquidus and solidus with a horizontal line that passes through the state point, as shown in Figure 1(b). A vertical projection from the intersection of the tie line and the liquidus defines the composition of the liquid phase. A vertical projection from the intersection of the tie line and the solidus defines the composition of the solid phase.
For the example in Figure 1(b), the alloy is composed of 50% material A and 50% material B. For the defined state point, 79% of the liquid material is element A and 21% is element B, and 31% of the solid phase material is element A and 69% of the solid material is element B. In addition, the percent of the material in the liquid and solid phases can be determined from the phase diagram.
From mass balance, the total material must equal the sum of the masses of the components; that is,
mt = ml + ms ………..(Equation 1)
Where mt = mass of total material, ml = mass of the total material that is in the liquid phase, ms = mass of the total material that is in the solid phase.
This mass balance also applies to each of the component materials; that is,
pBmt = plBml + psBms ………..(Equation 2)
Where plB = percent of the liquid phase that is composed of material B
psB = percent of the solid phase that is composed of material B
pB = percent of the material that is component B.
From these two equations, the amount of material in the liquid and solid phases can be derived as

Phase Diagrams of Insoluble Materials
The discussion thus far has dealt with two completely soluble materials. It is equally important to understand the phase diagram for immiscible materials, that is, for components that are so dissimilar that their solubility in each other is nearly negligible in the solid phase.

diagram, insoluble solids.
Figure 2 shows the phase diagram for this situation. The intersections of the liquidus with the right and left axes are the melting points for each of the components. As the materials are blended together, the liquidus forms a V shape. The point of the V defines the combination of the components that will change from liquid to solid without the formation of two phases.
This point defines the eutectic temperature and the eutectic composition for the components. The solidus is horizontal and passes through the eutectic temperature.
There are two areas on the graph with two phases. The area to the left of the eutectic composition will have solid component A, and the liquid phase will be a mixture of the A and B components (vice versa for the area to the right of the eutectic composition).
The sudden phase transformation at the eutectic temperature means that the grains do not have time to grow as the material cools. Thus, the eutectic material will have a fine grain structure.
As the material cools at a temperature other than the eutectic temperature, one of the components becomes solid as the temperature drops below the liquidus. As a result, the amount of this component in the liquid continuously decreases as the material cools in the two-phase area. In fact, the composition of the liquid will follow the liquidus as the temperature decreases.
When the eutectic temperature is reached, the remainder of the liquid becomes solid and has a fine grain structure. Starting with a composition of 80% B and 20% A, as in Figure 2, when the temperature is lowered to T, the liquid will contain 55% B and 45% A.
The amount of each component in the liquid and solid phases can be determined by mass balance (Equations 1 and 2). At T, this will yield 44.4% liquid and 55.6% solid; all of the solid will be component B.
Similarly, the composition of the solid at the eutectic temperature can be computed to be 66.7% solid B and 33.3% eutectic mixture. Since these materials are insoluble in the solid state, the eutectic mixture is composed of an intimate mixture of fine crystals of A and B, usually in a plate-like structure.
Phase Diagrams of Partially Soluble Materials
In between purely soluble and insoluble materials are the materials that are partially soluble. In other words, there is a solubility limit between the components of A and B. If the percent of component B is less than or equal to the solubility limit, on cooling all of the B atoms will be in solution with the A component.
If the percent of the B component is above the solubility limit, the atoms in excess of the amount that will go into solution will form separate grains of the component B. The result is shown on the phase diagram in Figure 3.

diagram, partially soluble material.
Note that the only difference between this phase diagram and the one shown in Figure 2 is the presence of the solid solution regions on each side of the graph. The composition analysis of the two-phase region is the same as that described for Figure 2.
Phase Diagrams of Eutectoid Reaction
Up to now, the phase diagram has been used to describe the transition between liquid and solid phases of materials. However, the lattice structure of some elements (e.g., iron) is a function of the temperature of the solid. As a result of the lattice transformation, the microstructure of the solid material changes as a function of temperature, as shown by the phase diagram in Figure 4.

When this occurs, a eutectoid reaction occurs on the phase diagram; it has characteristics similar to the eutectic reaction but is for a lattice structure transformation of the material rather than for a liquid–solid transformation. The rules for the analysis of the components of the material are the same as those discussed for the eutectic material.
As with the phase transformation at the eutectic temperature, the transformation of the lattice structure at the eutectoid temperature will result in fine-grained materials.